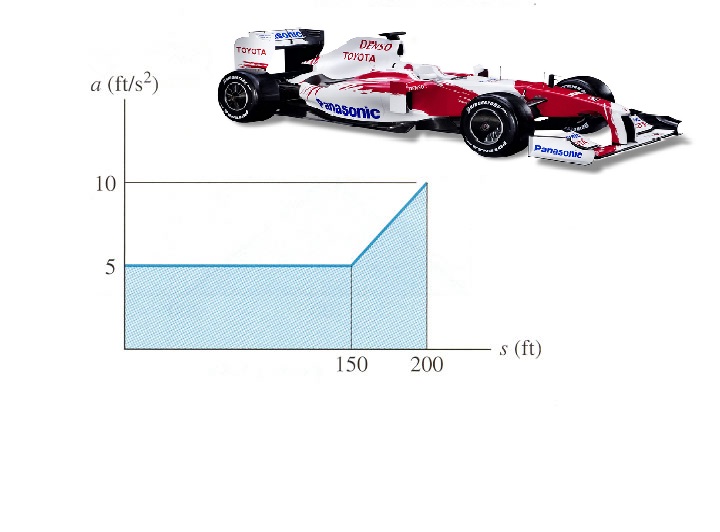
The acceleration versus position graph (not acceleration versus time) for the experimental car is shown above. Assuming the car starts from rest, find a) the distance the cart has traveled when the velocity is 22 ft/s, b) the distance the car has traveled when the velocity is 53ft/s and c) the velocity when the car has traveled 200ft. Presume the acceleration profile continues as shown beyond 200ft.